Down 1.2% from 157,023 a year earlier.
Research / The H-1B Demand Report
The H-1B Demand Report · July–September 2026
H-1B requests barely moved. The mix did.
Total requested positions and new-employment positions were close to a year earlier. The clearest change was inside the filing categories.
The quarter in three numbers
Up 0.6% from 20,185 a year earlier.
Up 0.2% from 103,285 a year earlier.
These are positions on certified applications and a count of those applications. They are not counts of hires, visas issued or unique workers.
The short answer
The headline totals were stable
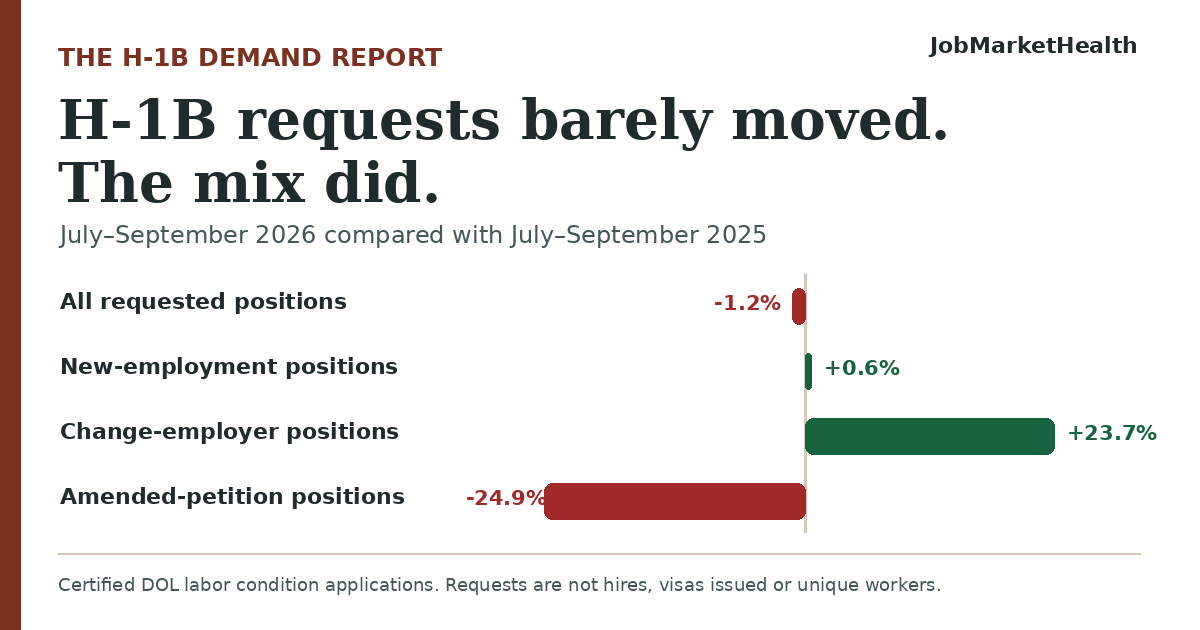
From July through September 2026, the Department of Labor certified almost the same number of H-1B labor condition applications as it did a year earlier. The applications covered 1.2% fewer positions overall, while positions marked for new employment increased 0.6%.
Changes that small do not support a story of a broad surge or collapse. The more useful signal was how employers classified the requests inside those applications.
Why this matters: “H-1B demand” can refer to applications, requested positions or one purpose reported on an application. Those measures answer different questions.
Change-employer requests rose as amended petitions fell
Positions reported under change of employer increased to 41,892, up 23.7% from 33,870 a year earlier. Positions reported under amended petitions fell to 29,627, down 24.9% from 39,443.
Those categories are employer-reported fields and should not be treated as parts of a simple pie chart. The data does not show why the mix changed, and it does not tell us how many people ultimately changed jobs or started work.
Look closer
Occupation trends moved in different directions
Software developers remained the largest occupation in new-employment requests among the examples below. Data scientist requests rose, while registered nurse and software quality assurance requests fell.
| Occupation | Jul–Sep 2025 | Jul–Sep 2026 | Change |
|---|---|---|---|
| Software developers | 4,788 | 4,949 | +3.4% |
| Data scientists | 570 | 993 | +74.2% |
| Registered nurses | 831 | 612 | −26.4% |
| Software quality assurance analysts and testers | 472 | 360 | −23.7% |
These are selected occupations, not a ranking of every occupation. Percentages compare the same three DOL decision months in each year. A small base can produce a large percentage change. The explorer below currently uses an earlier April–June 2026 source file, so its figures differ.
Explore more occupations on JobMarketHealth →What this means
Useful context, with limits
Does an increase mean those jobs are open now?
Not necessarily. These applications were decided from July through September, and a certified application is one step in a longer process. It is a look at employer requests during that period, not a live job board.
Does this tell us whether U.S. workers are being replaced?
No. These records cannot answer that question. They do not link individual requests to hires, layoffs or employment outcomes. A change in requests alone cannot establish displacement or explain its cause.
How should a job seeker use it?
Use it to see which occupations appeared in these requests and how the numbers changed. Then look at the wider job market, including pay, employment and opportunities for that occupation. H-1B requests are only one part of that picture.
How we made this report
We compare positions on H-1B labor condition applications certified by the Department of Labor from July 1 through September 30, 2026 with the same dates in 2025. We use DOL decision dates. Each application may cover more than one requested position, and people may appear in more than one application.
- U.S. Department of Labor: Foreign Labor Certification performance data, FY2026 Q4 and FY2025 Q4 disclosure files.
- Observation periods: July 1–September 30, 2026 and July 1–September 30, 2025.
- Release: DOL labels the files FY2026 Q4 and FY2025 Q4. Its listing does not display a separate release date.
- Retrieved: November 17, 2026. Published: November 17, 2026.
DOL's page describes disclosure data as cumulative, but both Q4 workbooks retrieved for this report contain only July–September decisions. We used the dates in the files and compared matching three-month periods. We independently recalculated the figures with a second workbook reader. The site's live H-1B explorer still uses an older April–June 2026 snapshot.