Research · Hiring momentum
Low claims, little hiring momentum
New unemployment claims remain below 200,000. JobMarketHealth’s three-month comparison shows why that encouraging signal does not yet amount to a hiring rebound.
The short version
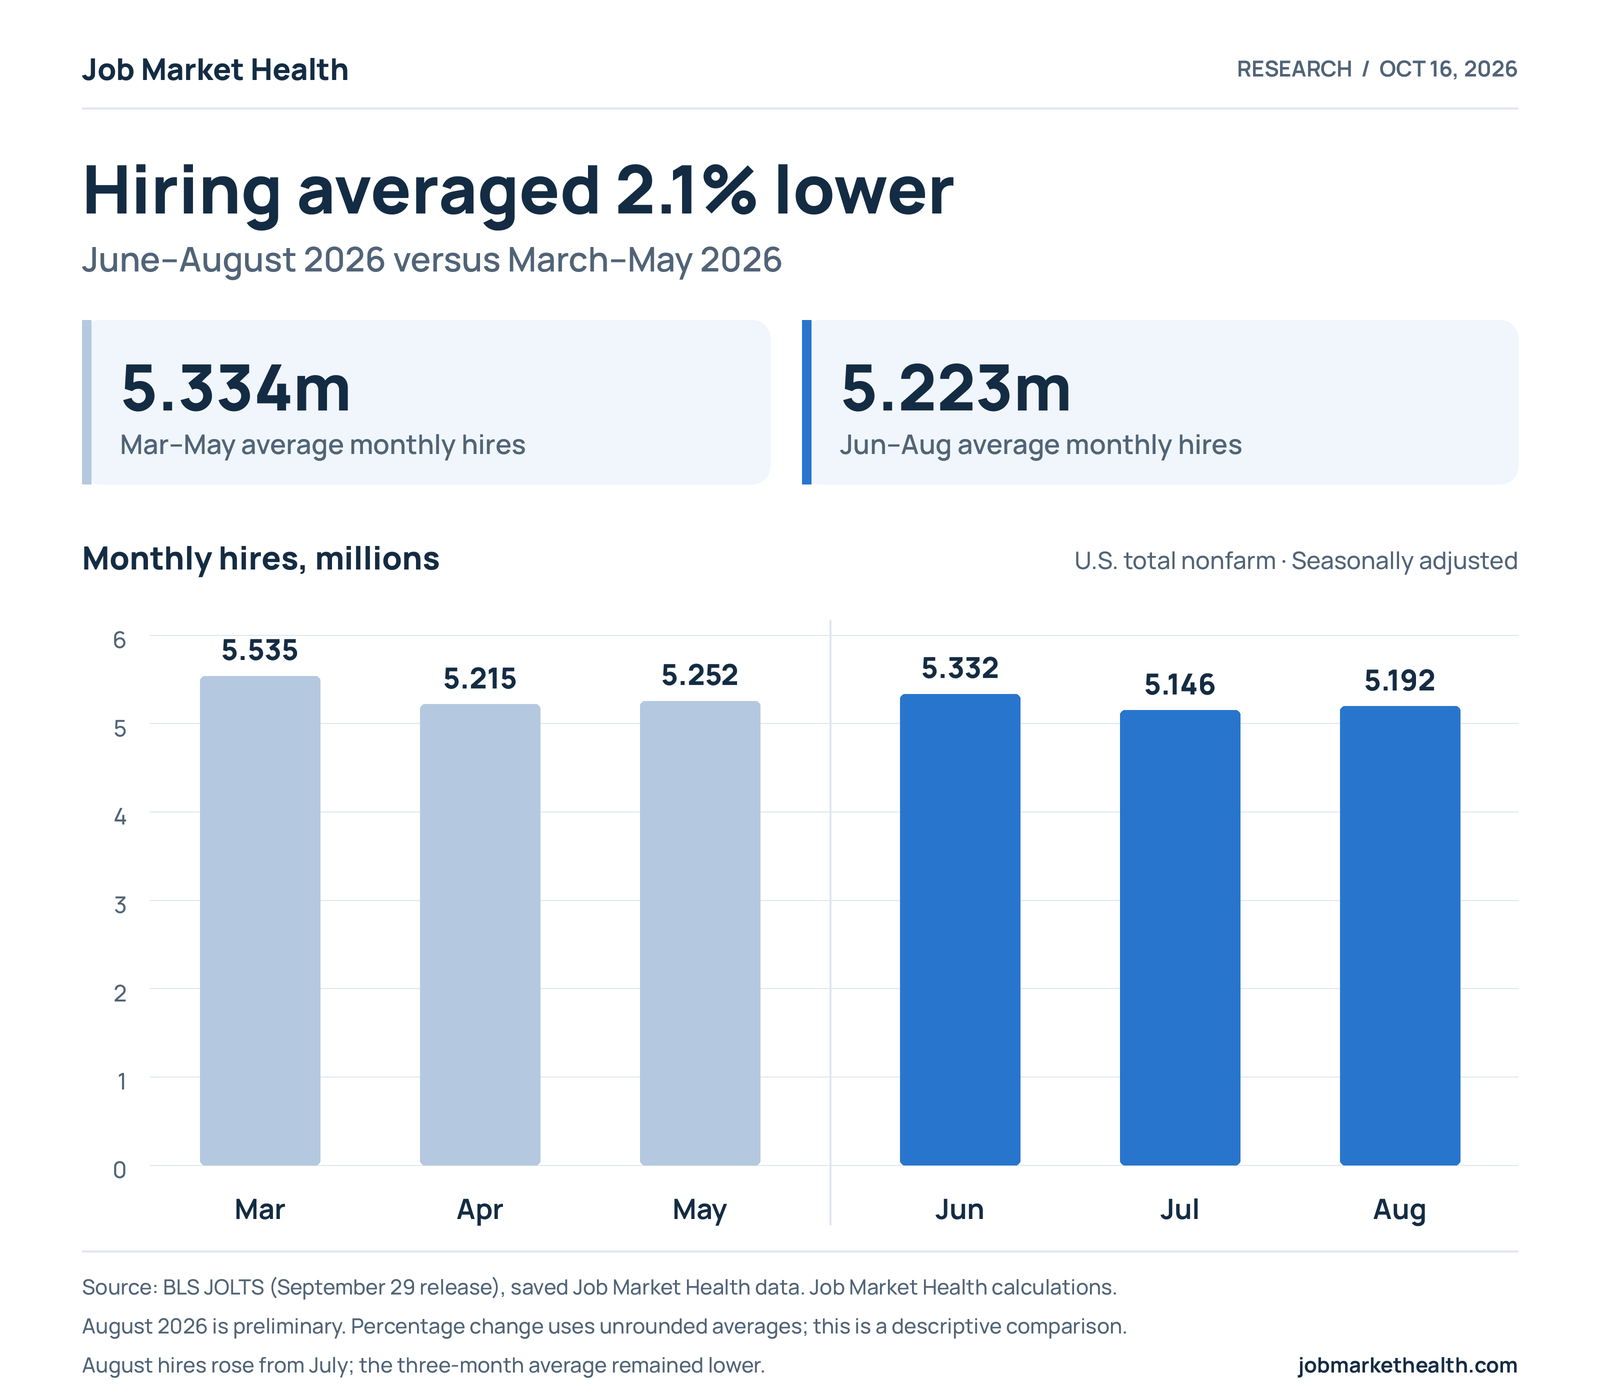
U.S. employers averaged 5.223 million hires per month in June–August 2026, 2.1% below March–May. August improved slightly, and the result is sensitive to the comparison window. Low claims and limited hiring momentum can coexist.
The latest claims release is reassuring about job stability. The hiring evidence is more restrained: a small August rebound has not lifted the latest three-month average above the preceding period. That supports a narrow conclusion: stronger hiring is not established by this comparison. It does not establish a collapse, explain the causes, or predict any individual job search.
The hiring comparison behind the headline
JobMarketHealth’s hiring-momentum comparison uses seasonally adjusted national JOLTS hires. Employers averaged 5.334 million hires per month in March–May 2026 and 5.223 million in June–August. That is approximately 111,000 fewer hires per month, a decline of 2.1%.
These are gross hires, including rehires, rather than the net change in payroll employment. The comparison asks whether the pace of hiring increased across two adjacent three-month periods. On this measure, the latest window does not support stronger hiring.
What the new claims report adds
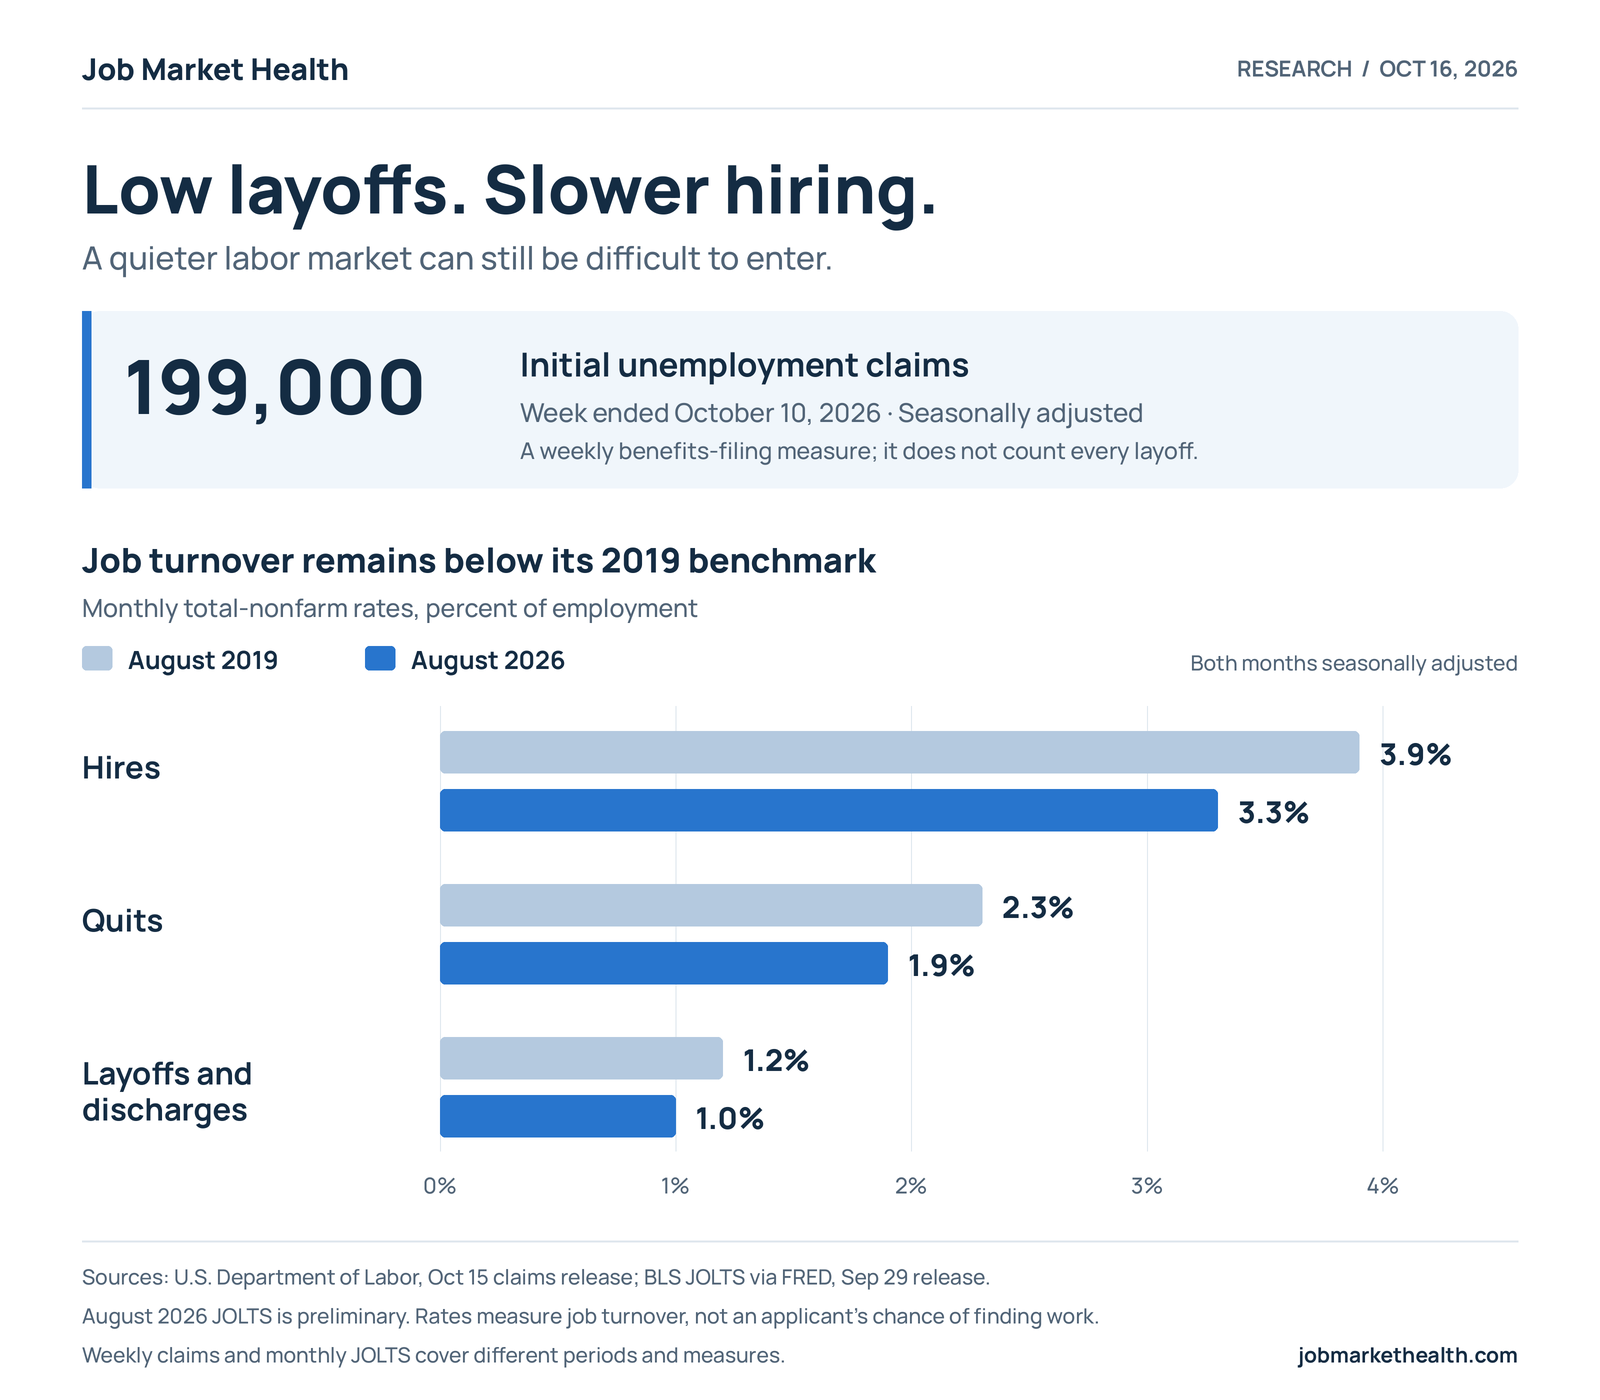
The October 15 unemployment-insurance release reported 199,000 initial claims for the week ending October 10, with a four-week average of 198,500. Continuing claims were 1.710 million for the week ending October 3, down 4,000 from the revised preceding week. Both initial and continuing claims were below their comparable year-earlier levels.
Those are encouraging observations. They are external national, seasonally adjusted DOL figures, separately sourced from the hiring analysis. They should not be confused with JobMarketHealth’s state-level, not-seasonally-adjusted claims data. The reassuring claims figures make a separate question worth asking: is the pace of hiring improving?
The counterevidence matters
August hires rose to 5.192 million from 5.146 million in July, an increase of 46,000, or 0.9%. August also exceeded the year-earlier level by 47,000, again about 0.9%. The newest month therefore improved on both comparisons.
The adjacent-window check is also important. Comparing May–July with February–April produces a roughly 0.5% increase, below the analysis’s 2% material-change threshold. Moving both windows forward one month changes the result to −2.1%, only just beyond that threshold. The threshold is an analytical convention, not a test of statistical significance.
Taken together, these results support cautious language about limited momentum. They are too sensitive to the chosen window to justify a claim that hiring has entered a decisive new downturn.
A longer benchmark shows subdued turnover
Separately sourced BLS/FRED rates provide historical context. Between August 2019 and August 2026, the hires rate moved from 3.9% to 3.3%, the quits rate from 2.3% to 1.9%, and the layoffs-and-discharges rate from 1.2% to 1.0%. These are seasonally adjusted monthly rates relative to employment.
The hires rate was 0.6 percentage points lower, approximately 15% below its August 2019 level. This is a comparison of rates, not a 15% reduction in an applicant’s chances. The benchmark illustrates lower turnover on several measures, including fewer employer-initiated separations. It is external context, not an output of the saved JobMarketHealth hiring-momentum calculation.
What readers should take away
Job stability and access to the next job are different dimensions of labor-market health. Claims help assess benefit-filing activity; hiring measures how many additions employers make to payrolls. Neither is a complete measure of job-search conditions.
For someone looking for work, low national claims alone should not be treated as proof that opportunities are expanding. For analysts, the useful next question is whether hiring improvement persists across several months and comparison windows. A single modest rebound is encouraging, but it is not enough to settle that question.
These data do not identify the causes of subdued turnover. They cannot isolate AI, financing costs, workforce composition or hiring practices. The defensible conclusion remains limited: low claims are good news for job stability, while stronger hiring is not established by this three-month comparison.
Data & methodology
- Sources
- BLS JOLTS hires, saved JobMarketHealth observations; BLS JOLTS rates via FRED, external context; DOL weekly national claims release, external context
- Data through
- August 31, 2026; August 31, 2026; October 10, 2026
- Retrieved
- October 15, 2026; October 16, 2026; October 16, 2026
Analysis available October 16, 2026. The native hiring comparison uses national, seasonally adjusted JOLTS levels in thousands: March 5,535; April 5,215; May 5,252; June 5,332; July 5,146; August 5,192. Average each three-month window, then calculate (latest/prior − 1) × 100. The adjacent-window check additionally uses February 4,899. August JOLTS is preliminary; the release vintage is September 29. External claims cover October weeks and are not simultaneous observations of August hiring. The external 2019 benchmark uses rates, not hire levels. Figures are subject to revision; no causal or statistical-significance claim is made.
Suggested citation
JobMarketHealth (2026). “Low claims, little hiring momentum” JobMarketHealth Research, 2026-10-16. Research Standard v1.0.8. https://jobmarkethealth.com/research/low-claims-little-hiring-momentum-october-2026